

Investigative Analysis: Pennsylvania Election, 2024, Part 3
Part 3: The Fallout

Part 3: The Fallout
On November 6, 2024, Americans woke to the headline that Trump had secured victory in the 2024 Presidential race. Pennsylvania, as well as most of the other swing states, had been decided overnight. The public had been primed for weeks by pundits and commentators to expect a tight race – if not an all-out repeat of 2020, when it had taken Georgia and Pennsylvania multiple days post-election to declare a winner. The polls had indicated a perfect tie, a dead heat, a coin flip between Harris and Trump on the day before the election.
Instead, Pennsylvania – and the fate of the 2024 Presidential election – on the morning of November 6, seemed all but decided. As the final ballots were counted, it became clear that the vote margin between candidates had been large enough to avoid triggering an automatic recount. (In the end, Trump won all seven swing states by “just” enough to avoid automatic recounts.)
After the election was called, many Pennsylvanians sat uneasy with questions. After all, there had been dozens of bomb threats throughout the state on Election Day. Where was the investigation into these? Who initiated them, and for what purpose? And why did so many historically “blue” communities across the state flip “red”? Why weren’t community leaders asking for recounts to ensure the integrity of the election? Why was the only major recount in the state, the race between Senator Bob Casey and Dave McCormick, prematurely terminated?
And when it was time to audit the results, did the Pennsylvania state government quite literally roll the dice (shown below) to decide which precincts were to be reviewed?

In January 2025, then-President Elect Trump made remarks on stage during the pre-inauguration rally in Washington, D.C. that were a game-changer for the Election Truth Alliance (ETA):
“--and he knows those computers better than anybody. All those computers, those vote-counting computers… and we ended up winning Pennsylvania like in a landslide, so. It was pretty good, it was pretty good. So thank you to Elon…!”
Less than a month after the ETA was founded, less than a week after receiving state sign-off on non-profit paperwork, and less than a day after posting their first full data analysis report for Clark County, the ETA decided to pivot and turn its immediate attention directly on Pennsylvania.
We quickly learned that voting in Pennsylvania is a complicated matter. The counties all report their election data separately and in different formats. Stories of chaos and disruption across the state on Election Day – bomb threats, machine failures – were still trickling into the news cycle in the weeks after November 5th.
At the time of Trump’s pre-inauguration rally on January 19th, state election results had only been posted online for nine days, and the ‘picture’ of the results was still murky. But, as our research unfolded and we reviewed precinct-level data across Pennsylvania, a prominent pattern emerged. Mail-In data looks as expected, but Election Day does not. When data of both vote types is combined in county vote totals, the unusual trends found specifically in the Election Day data are harder to identify. However, when isolating Mail-In votes and Election Day votes, the contrast in their patterns is stark.
In addition, ETA’s analysis finds that counties that were victims of bomb threats on Election Day and counties that reported machine errors on Election Day demonstrate anomalous election results.
Observing Drop-Off in Pennsylvania
“Drop-off votes” are the difference between votes for the Presidential race and the next down-ballot race (for Pennsylvania in 2024, the Senate). While Harris ultimately secured 38,862 more votes statewide than the down-ballot Democratic candidate for Senate, Senator Bob Casey, Jr., a drop-off rate of 1.14%, she received fewer votes in 47 out of 67 counties than Casey. Trump’s total vote count was substantially higher, 144,013 more votes than Republican challenger Dave McCormick, for a drop-off rate of 4.06%.
The ETA’s drop-off analysis examined results both in aggregate and by vote type, and it highlights a different statewide pattern when comparing Mail-In votes to Election Day votes. Votes cast by mail were in the expected range (1-2%) of drop-off rates for both candidates, whereas votes cast in person on Election Day show an unexpected disparity.

This contrast between drop-off rates for Harris and Trump is striking when each county across the state is broken out separately.
While Harris receives a positive drop-off rate in a few counties, and Trump receives a negative drop-off rate in one county, the overall trend remains.
When Election Day votes are isolated, Trump’s drop-off rates are noticeably higher, while Harris’ are drastically lower, mostly in the negative. In one Pennsylvania county, Harris nearly falls to a -15% drop-off rate – meaning 15% more voters cast a ballot for the Democratic Senate candidate than for the Democratic Presidential candidate.
The dramatic nature of the drop-off trend in Election Day becomes far more apparent when this vote type is isolated.
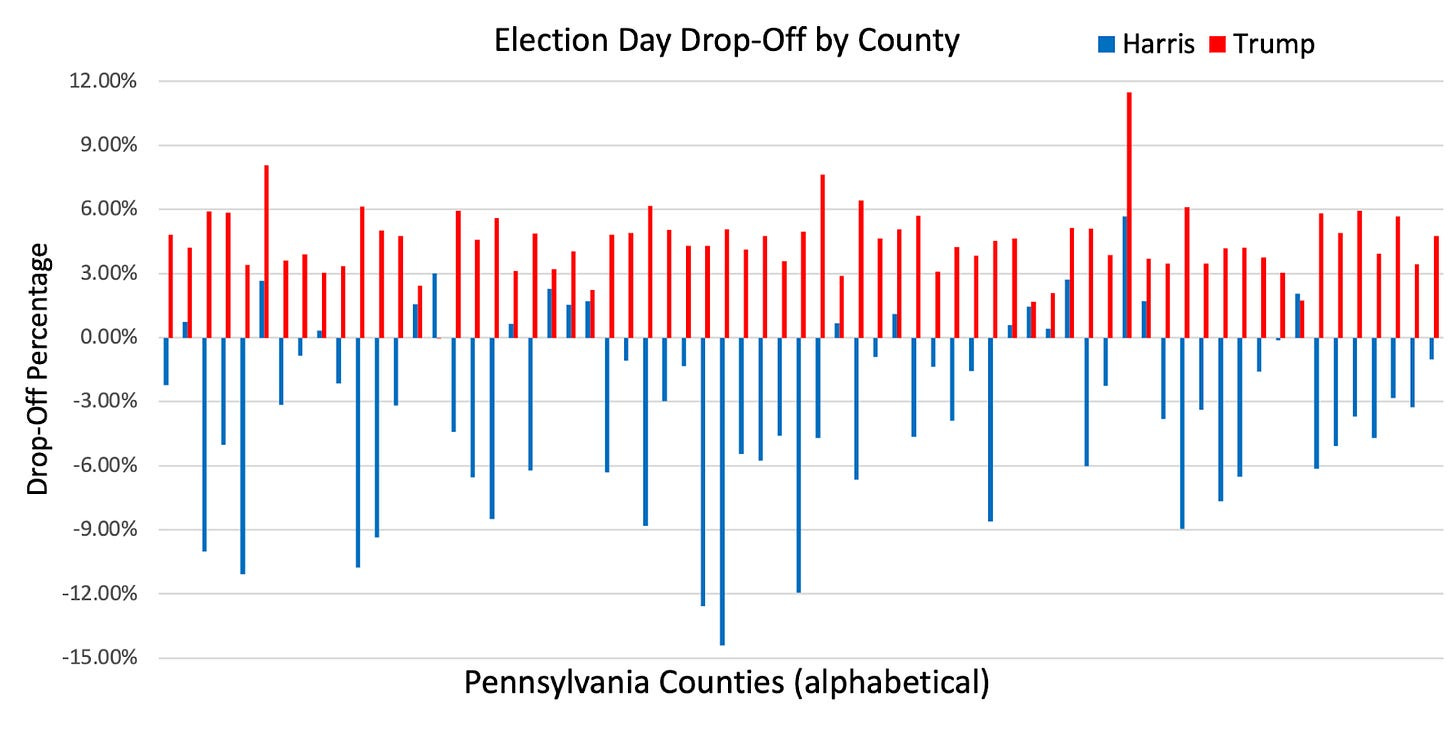
Some of the counties with the largest difference in drop-off rates include Cambria (-8.07%) and Fayette (-6.16%), two of the counties with irregular Election Day activity, as reported in Part 2 of our Investigative Analysis of the 2024 Pennsylvania election.
In isolation, a difference in drop-off rates between candidates is not necessarily indicative of manipulation. However, especially pronounced differences in dropoff rate require further scrutiny. Studies of election forensics acknowledge drop-off as a potential indicator of manipulation, particularly if the pattern differs from historic trends in that area.
More Votes Cast at Precinct = Votes Skewed Towards One Candidate
In fair elections, we expect to see normal human variation but also a reflection of the voting patterns inherent within a community.
The chart below is called a scatter plot. Each pair of 1 red + 1 blue dot = data from one precinct. The x-axis (horizontal) shows total votes cast; the y-axis (vertical) shows candidate “vote share” (percentage of the overall vote a candidate has received). For example, if Kamala Harris received 45% vote share, Donald Trump may have received 55%.
Here is an example of “normal-looking” data on this type of scatterplot – preliminary analysis of San Mateo County, California, in 2024:

‘Vote Center’ here means Election Day votes plus early voting. We can see a difference between Vote Center and Mail-In votes, but we also see a general, consistent trend reflective of the historical voting patterns of the San Mateo community. There is normal human variation, meaning the dots look a bit random, as would be expected in the results of a fair election.
Here is Allegheny County, Pennsylvania, in the 2024 Presidential race:

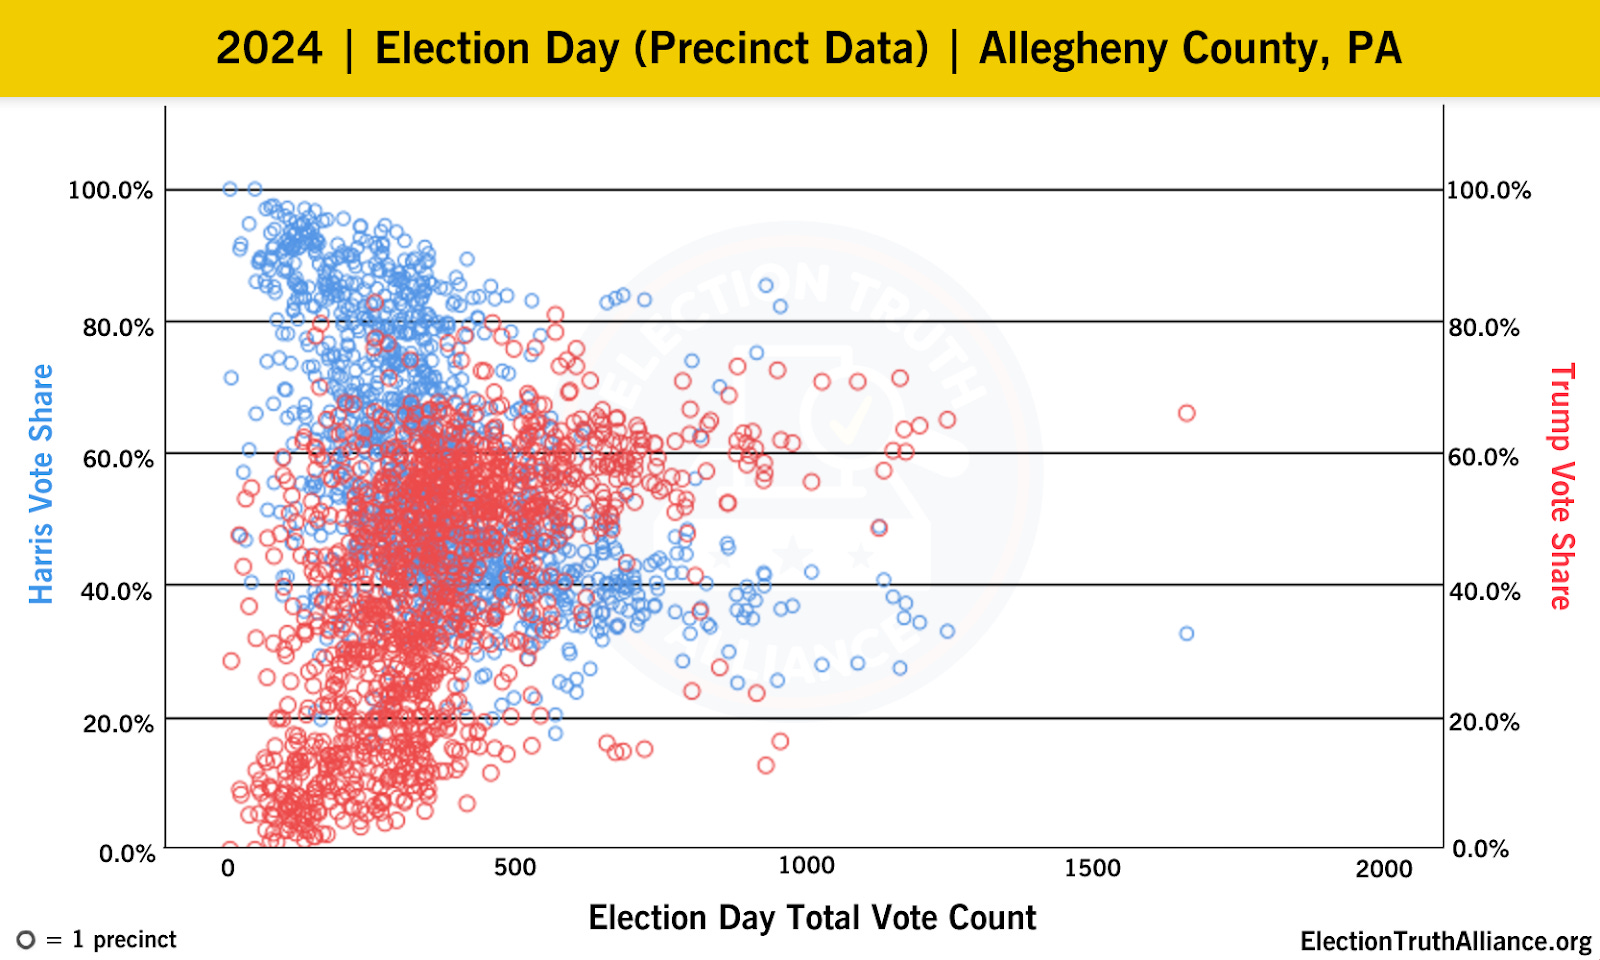
While Mail-In votes look largely as expected, the pattern on Election Day does not. This scatter plot demonstrates that, in precincts where a certain threshold of cast votes is exceeded, a pronounced difference in patterns is revealed. Essentially, one candidate benefited, unexpectedly and disproportionately, in precincts where more votes were cast. Notably, the ETA has documented striking similarities to the patterns seen in Pennsylvania in our analysis of Clark County, NV.
Precincts With High Turnout
Voter turnout is often considered one of the most important data points in the forensic analysis of election results. High voter turnout is usually a welcome factor in any election, as it means more people are participating in the electoral process, and more voices are represented. The more people vote, as we’ve been told, the more accurate view we have of the will of that community.
However, this norm only holds true if all of those votes are real. If an election official in Russia or Georgia stuffs handfuls of falsified ballots into a ballot box, these would be a false indicator contributing to “high turnout”. Or, say an election official picks up the phone and falsifies a report of a higher number of votes for their preferred candidate to the Secretary of State. In these examples, high turnout is reported, but only at some polling stations – and only benefiting one party.
The exact same principle applies to electronic forms of election fraud. Instead of an official stuffing a ballot box, we may see a hacked “ePoll book” or a compromised vote-counting tabulator.
If a candidate receives a high percentage of votes cast, but disproportionately receives those votes in places where there was very high voter turnout, it may be an indicator that some of those votes were artificially inflated.
Let’s look at Erie County. The below charts are histograms, and on such a chart, in a free and fair election, we would expect to see the results forming a bell-like shape curve.
Below is Erie County 2024 Mail-In Votes, by turnout. Each candidate’s results represent a bell-shape, indicating that neither candidate benefits disproportionately at higher levels of turnout.

And now, Erie County 2024 Election Day, by turnout:

The dashed line indicates the point at which Trump begins to overtake Harris – around the 50% mark. After that, high turnout disproportionately benefited Trump.
This pattern, only present in Election Day data, not Mail-In data, is present with varying degrees of severity in numerous counties throughout Pennsylvania.
Insufficient Audits
Pennsylvania conducted two post-election audits, a 2% Statistical Audit and a Risk-Limiting Audit (RLA), which reviewed votes from 55 randomly selected precincts.
By the Pennsylvania State Department’s own admission, the 2% audit is not statistically foolproof, which is why the state recently implemented the RLA.
In 2024, the RLA, the parameters of which were set by a roll of the dice, only audited the State Treasurer’s race, NOT the presidential race. Additionally, of 9000 precincts in PA, about 1700 (20%) are in Philadelphia County. Of the 55 precincts audited during the RLA, only 1 was from Philadelphia County.
Conclusions
Disruptions occurred across Pennsylvania on Election Day. Bomb threats and machine failures resulted in deviation from normal voting procedures, potentially granting bad actors an opportunity to interfere with vulnerable voting infrastructure.
Election Day precinct-level voting data shows signs of potential vote manipulation. Similar trends are not clearly present in Mail-In voting data.
Possible Artificially Inflated Turnout. Unusually high voter turnout warrants further scrutiny. One candidate benefitting from unusually high turnout has been credibly associated with election fraud in other countries.
Inconsistencies in the 2024 Pennsylvania election become obvious when vote types are examined in isolation. Remember, there was no in-person early voting in Pennsylvania, only mail-in and “on-demand mail-in voting” – both of which use hand-marked paper ballots. As these paper ballots are counted under strict and centralized conditions, the opportunity to manipulate Mail-In and “Early Voting” in Pennsylvania was limited, and if there were intentions to manipulate Pennsylvania’s vote count, the best opportunity to do so would be on Election Day. ”Disruptions” across the state on Election Day - such as reported bomb threats and equipment malfunctions - may have been part of a larger coordinated opportunity to gain physical access to electronic voting infrastructure in Pennsylvania precincts.
Recognizing that Mail-In results and Election Day results demonstrate a completely different pattern in multiple locales throughout the state, we can begin to understand that the Pennsylvania Election Day vote may have been compromised.
The Blue Ribbon Commission on Pennsylvania’s Election Security, in its report published prior to the 2020 General Election, states that, within the election infrastructure of Pennsylvania, “there are multiple potential points of exposure during tallying and election-night reporting. The primary concern is an attack that could compromise the integrity or the availability of the tabulation of votes.” The Commission says that “as a battleground state, the Commonwealth remains a prime target for adversaries wishing to disrupt the US electoral process and continued improvements and vigilance are necessary.”
We believe that Pennsylvania’s 2024 election results require an immediate and thorough audit, including a hand recount of ballots in suspect counties. The citizens of Pennsylvania deserve the truth about the integrity of their election and to know that their vote - and their voice - is counted.
Confidence in the integrity of our elections is essential for a successful democracy. The ETA intends to take the following actions:
Demand Hand Audits of Paper Ballots
We urge voters and election officials in the state of Pennsylvania to seek additional audits of the election equipment used and ballots cast during the November 5th, 2024 General Election. There are too many statistical anomalies in this election that warrant further investigation.
Share
Please share our findings with local media outlets, politicians, and election security experts in Pennsylvania. Spreading the word about these issues is crucial to our election security.
Reach Out
If you are a voter in the state of Pennsylvania, contact your local Representatives and County Officials to seek answers to these questions, discuss our findings, and express how serious of an issue this is. Request a hand recount of ballots be conducted to ensure the integrity of our elections is upheld and every registered voter's election choices are cast and recorded properly.
How Can You Support the Cause?
The Election Truth Alliance needs help from a wide variety of skill sets. If you can help, please fill out our Volunteer Sign-Up form on our website.
We are a non-partisan, non-profit organization that doesn’t accept money from politicians or political action committees. You can help our work by donating at the ‘Donate’ tab on our website ElectionTruthAlliance.org
Last but not least, contact your local officials and request that all ballot data be made public. This information is crucial in our effort to #VerifyTheVote and #SecureTheMidterms.
Sign our petition to demand an audit of the 2024 Pennsylvania election.
Disclaimer: Election Truth Alliance (ETA) is a non-profit, nonpartisan, volunteer-led organization dedicated to free and fair elections. Our present focus is on the 2024 Presidential Election in which we took a keen interest after election and cybersecurity experts announced the appearance of numerous irregularities in the election results. For this endeavor, ETA brought together a broad range of experts, which span across multiple disciplines, including, but not limited to, data analysis, political science, cybersecurity, auditing, computer engineering and bioengineering. Opinion and analysis is based on current data available.
ETA employed a data-driven analysis of the Cast Vote Records (CVR), corresponding voter data, ballot images and other accessible information; such analysis was performed at each stage of the voting process, from early in-person voting, mail in ballots to day of in-person voting.
All posts are subject to update as new or corrected information is brought to our attention, or if there is other information to share with readers.
Why not share this with Rachel Maddow?
If there is actual proof, why can’t that be taken to the highest court in the land? I don’t want to wait till the next election to do paper ballots! I want him out now! He cheated, we all know it and yet no one is doing a GD thing about it. Nothing is being done! He cheated, and look at what he’s doing to America! How does he get away with this? It’s not fair. It’s not fair to citizens and it’s certainly not fair to Kamala! Something needs to be done.